

December 21, 2011
Current Status of Renewable Energy in Japan (2011)
Keywords: Renewable Energy
Efforts to introduce renewable energy have begun to accelerate worldwide. These forms of energy do not promote climate change and are important from an energy security perspective. Despite this global trend, Japan has lagged far behind in promoting renewable energy. The Great East Japan Earthquake on March 11, 2011, and the subsequent serious accident at the Fukushima Daiichi nuclear power plant owned by Tokyo Electric Power Co, strongly raised individual awareness about saving electricity and energy issues. On August 26, 2011, the law on renewable energy came into effect including provisions for a feed-in-tariff (FIT) scheme (to pay smaller producers who supply electricity to the power grid) to begin on July 1, 2012. These factors are causing substantial changes in the prospects for renewable energy in Japan.
Related JFS articles:
- New Survey Asks How Nuclear Accident Changed Public Awareness of Japan's Energy Future
- Open Platform for Energy Policy Discussion Launched
- Japan Begins Feed-in Tariff Scheme to Accelerate Renewable Energy Promotion
JFS launched a web page in 2010 to report on Japan's current renewable energy situation. One year has passed since then, so we have updated our numbers to show the latest data, including the amount of power generation. (Updated figures and other data are shown in italics).
The following table shows how much of each type of renewable energy is generated domestically, and its proportion of total power generated in Japan. What is your reaction when you see these numbers?
(Click on a renewable type for more details.)
| Renewable Type | Power Generation (GWh) | Percent |
| Solar Photovoltaic (PV) | 2,966 | 0.3% |
| Wind | 3,830 | 0.3% |
| Geothermal | 2,908 | 0.3% |
| Small-Scale Hydropower | 17,280 | 1.6% |
| Biomass | 11,624 | 1.0% |
| Total | 38,608 | 3.5% |
The above figures were calculated based on the following:
- Solar photovoltaic: Calculated based on a 12% utilization rate of total capacity; JPEA domestic shipments were used to estimate total capacity.
- Wind: Calculated based on a 20% utilization rate of total capacity; NEDO data collated by JWPA to estimate total capacity.
- Geothermal: Figures from "Current Status and Trends in Geothermal Power", published by the Thermal and Nuclear Power Engineering Society (2008).
- Hydropower: Calculated based on a 61% utilization rate of total capacity; facilities included come from the "Hydropower Stations Database", published by the Japan Electric Power Civil Engineering Association. Included power stations are the conduit/run-of-river type and pondage type stations with maximum generation capacity of up to 10,000 kW, and Renewable Portfolio Standard (RPS) eligible facilities.
- Biomass: Calculated based on a 70% utilization rate of total capacity, assuming that 60% of fuel is biomass. Included power stations were RPS eligible facilities with a biomass ratio of about 60% or greater. Energy source breakdown is as follows: general waste power generation (56%), industrial waste power generation (36.6%), food/livestock biomass (1.6%), woody biomass (5.8%).
*Total Power Generation in Japan: Includes major electric power utilities, other electric power producers, and in-house power generation. ("EDMC Handbook of Energy & Economic Statistics in Japan (2011)")
The graph below shows proportions of overall domestic energy generation in FY2009, by source.
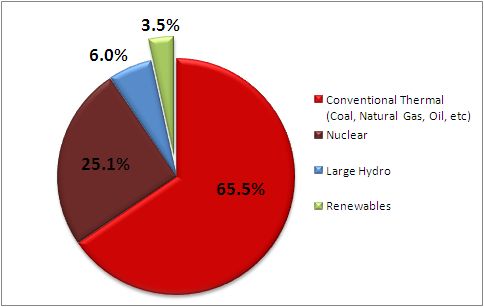
Proportions of Energy Generated, by Source (2009)
Figures for renewables were calculated based on the "Renewables Japan Status Report 2011." Other figures were calculated based on the "EDMC Handbook of Energy & Economic Statistics in Japan (2011)"
Produced in collaboration with the Institute for Sustainable Energy Policies (ISEP): http://www.isep.or.jp/en/
References:
- Renewables Japan Status Report 2011 (Japanese):
http://www.re-policy.jp/jrepp/JSR2011/ - (Renewables Japan Status Report 2010, English version) :
http://www.re-policy.jp/jrepp/JSR2010SMR20101004E.pdf - EDMC Handbook of Energy & Economic Statistics in Japan: http://www.ieej.or.jp/edmc/public/publication-e.html
Related
"JFS Newsletter"
- 'Yumekaze' Wind Turbine Project Connects Metro Consumers and Regional Producers: Seikatsu Club Consumers' Co-operative
- Shaping Japan's Energy toward 2050 Participating in the Round Table for Studying Energy Situations
- Nishiawakura's Initiative for 100% Energy Self-Sufficiency, and a Municipal ICO Scheme
- Actions Toward 100% Renewable Energy in Japan
- Sustainable Community Building in Shimokawa: Recycling-Oriented Forest Management Enabling Permanent Use of Forest Resources
Related
"Popular Articles"
- Current Status of Renewable Energy in Japan (2015)
- Offshore Wind Farm Withstands Great East Japan Earthquake and Tsunami
- Current Status of Renewable Energy in Japan (2014)
- Geothermal Power: Japan Has World's Third Largest Geothermal Reserves, 60 Percent of Which Can Be Developed
- Tokyo Plans to Increase Renewable Energy Ratio to 20% by 2024
![]()

Some rights reserved. This work is licensed under a Creative Commons Attribution-NonCommercial-ShareAlike 3.0 License.