

November 15, 2015
Sustainable Energy and Food Zones Grow Gradually
Keywords: Civil Society / Local Issues Renewable Energy
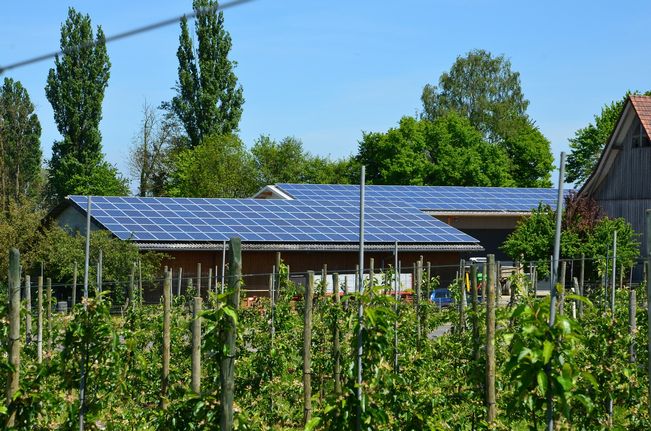
Image by hbruellmann Some Rights Reserved.
The Sustainable Zone Study Group, a research project jointly conducted by Kurasaka Environmental Research Laboratory at Chiba University and the Institute for Sustainability Energy Policies (ISEP), a Japanese non-profit organization, tracks current conditions and trends in renewable energy supply in Japan by region, and draws up an annual report on Sustainable Zones, which refer to areas where food and energy demand is fully met by locally available resources.
According to the Sustainable Zone Report 2014, released in late March 2015, solar power generation increased by 41.9% in FY2012 from the previous year, thanks to the renewable energy feed-in-tariff (FIT) scheme established under the Law on Special Measures Concerning Procurement of Renewable Energy Sourced Electricity, which went into effect in July 2012. Solar generation almost doubled in FY2013, increasing by 97.5%, and as of March 2014, solar power capacity is estimated to be 2.8 times that of March 2012. The growth in the supply of solar power generation contributed to the increase in renewable energy generation across Japan, which was up 8.5% in FY2012 and 25.3% in FY2013.
On the other hand, the FIT scheme remained less effective for non-solar renewable energy generation. Wind power generation grew by 3.4% in FY2012 and 2.9% in FY2013, and biomass power generation was up 2.2% and 8.5%, respectively. Although these figures show that biomass has started to take off, wind power generation has not. Micro-hydro power generation remained almost level, with growth of only 0.2% and 0.4%, respectively. Meanwhile, geothermal power generation slightly decreased in FY2012.
As for renewable heat, to which the FIT scheme does not apply, the use of solar thermal energy increased by 10% in FY2012 and 6.1% in FY2013, while use of biomass thermal slightly grew by 1.9% in FY2012 and 0.5% in FY2013. The total heat supply from renewable sources was up 4.5% in FY2012 and up 4.8% in FY2013. The supply of power from renewable energy sources has grown, and consequently, the proportion which renewable heat constitutes in overall renewable energy supply has dropped, from 20.3% (as of March 2012), to 19.7% (as of March 2013), and then to 17.0% (as of March 2014).
Renewable energy supply increased by 7.7% in FY2012 and 21.1% in FY2013, signifying a 30.6% increase during the two years from March 2012 to March 2014. As a result, the local energy self-sufficiency rate for Japan overall, which is the proportion of renewable energy supply relative to local energy demand (demand from consumers plus agriculture, forestry and fisheries), has slightly increased every year, expanding from 3.81% (as of March 2012), to 4.1% (as of March 2013) and to 4.97% (as of March 2014).
The number of 100% renewable energy zones, or municipalities producing renewable energy exceeding energy demand for use by consumers, agriculture, forestry and fisheries, has steadily increased from 50 in FY2011, to53 in FY2012 and 57 in FY2013. Also the number of 100% sustainable electricity zones, or municipalities producing more electricity from renewable sources than electricity demand for use by consumers, agriculture, forestry and fisheries, has increased from 84 in FY2011 to 86 in FY2012 and 89 in FY2013.
Among the 100% sustainable energy municipalities, 29 municipalities also exceeded 100% in food self-sufficiency. These communities are truly "Sustainable Zones". In addition to the 24 municipalities deemed "sustainable" as of late March 2011, five more municipalities have newly joined the Sustainable Areas: Kaminokuni, Hokkaido, Tsumagoi and Katashina, Gunma Prefecture, Kagamino, Okayama Prefecture and Nagashima, Kagoshima Prefecture.
Related
"JFS Newsletter"
- 'Yumekaze' Wind Turbine Project Connects Metro Consumers and Regional Producers: Seikatsu Club Consumers' Co-operative
- Shaping Japan's Energy toward 2050 Participating in the Round Table for Studying Energy Situations
- Nishiawakura's Initiative for 100% Energy Self-Sufficiency, and a Municipal ICO Scheme
- Actions Toward 100% Renewable Energy in Japan
- Sustainable Community Building in Shimokawa: Recycling-Oriented Forest Management Enabling Permanent Use of Forest Resources
Related
"Popular Articles"
- Current Status of Renewable Energy in Japan (2015)
- Offshore Wind Farm Withstands Great East Japan Earthquake and Tsunami
- Current Status of Renewable Energy in Japan (2014)
- Geothermal Power: Japan Has World's Third Largest Geothermal Reserves, 60 Percent of Which Can Be Developed
- Tokyo Plans to Increase Renewable Energy Ratio to 20% by 2024
![]()

Some rights reserved. This work is licensed under a Creative Commons Attribution-NonCommercial-ShareAlike 3.0 License.