

October 4, 2009
New Website Shows Vehicle CO2 Emissions by Municipality in Japan
Keywords: Climate Change Transportation / Mobility University / Research institute
Reprinted from Environmental GIS homepage, the National Institute for Environmental Studies
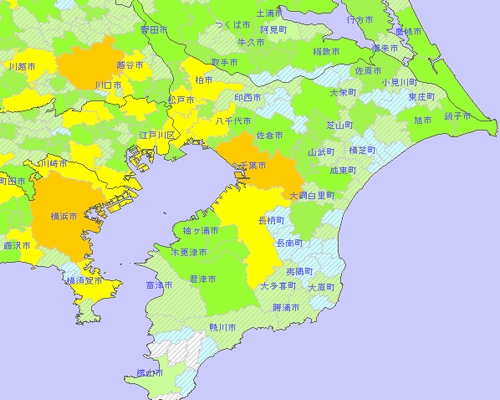
The National Institute for Environmental Studies (NIES) published a map of annual carbon dioxide (CO2) emission levels from vehicles, on July 6, 2009, on its Environmental GIS homepage. It provides status updates on environmental pollution by utilizing geographic information system (GIS) data. Information on annual CO2 vehicle emission levels are shown in different colors on the map by municipality, including emissions per person and total emissions. (See the website at the end of this article.)
The CO2 vehicle emissions shown on the map use estimated emissions figures by municipalities nationwide, calculated using an estimation method by NIES based on the Origin-Destination Survey data of 1999 and 2005 road traffic censuses. Clicking on the map for "emissions per person" reveals figures for calculated annual emission volumes from passenger cars, freight vehicles, and the total number of vehicles. The same information is shown for "total emissions."
In 2008, the Law Concerning the Promotion of Measures to Cope with Global Warming was amended, and the prefectures and major municipalities with populations of over 200,000 designated by the government are obligated to take assertive action to combat global warming. Looking at the map, the CO2 vehicle emissions according to municipality can be easily viewed; this method of visualization is expected to contribute to efforts to stop global warming.
http://www-gis5.nies.go.jp/carco2/co2_main.php (Available in Japanese only)
The National Institute for Environmental Studies (NIES) official website
http://www.nies.go.jp/index.html
Posted: 2009/10/04 06:00:15 AM
Related
"JFS Newsletter"
- Shaping Japan's Energy toward 2050 Participating in the Round Table for Studying Energy Situations
- Implementation of the Paris Climate Agreement: A Report on Japan's Round Table for Studying Energy Situations
- Auto Sales Industry Cooperates to Tackle Social Responsibility: Examples from Yamagata, Japan
- Yokohama FC: Leader in Eco-Activities through Football-Related Carbon Offset
Related
"Popular Articles"
- Large Ozone Hole Observed Again in 2011
- Japan's Pro Baseball Teams Start Eco-Project to Cut Energy Use by 6%
- Manufacturer Saving Energy by Growing Vertical Gardens on Factory Walls
- Sony Draws Up 'Road to Zero' Plan for Zero Environmental Footprint
- Tokyo Announces Innovative 10-Year Strategy against Climate Change
![]()

Some rights reserved. This work is licensed under a Creative Commons Attribution-NonCommercial-ShareAlike 3.0 License.